PremierOne Incident Dashboard

Dashboard is a crime data visualization solution that aims to provide investigators and decision makers with operational intelligence and real-time analytics. Starting in 2011 as a new product pilot project for PremierOneTM, it"s built in HTML5 and targets tablets such as the Motorola XOOM.
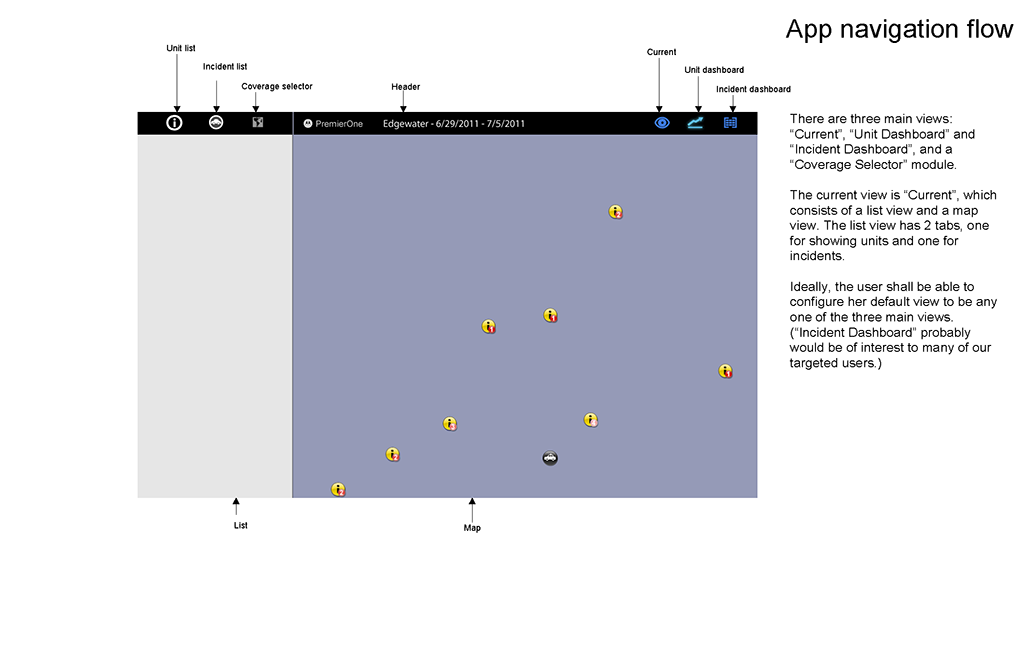
As the only user interface designer for the product, my role is to conceptualize, information architect, design and present the user experience. The inception phase comes with a fast prototype in Flash and mockup screens that attempt to capture highlights of the vision and elicit excitement from the stakeholders. After discussion with the product team, flow diagrams are developed to sort out information architecture following with UI requirement drafts and detailed screen designs. Rapid iterations of UI and data visualization design result from daily to weekly meetings with the engineering and the product teams. As a feature concept, I also proposed correlation analysis - comparing incident variables such as densities over time, occurring times and locations with three key operational "variables": officer response time, incident time in queue and incident priority - using data visualization. The final product is presented to the stakeholders and handed over to the PremierOne teams for integration.


